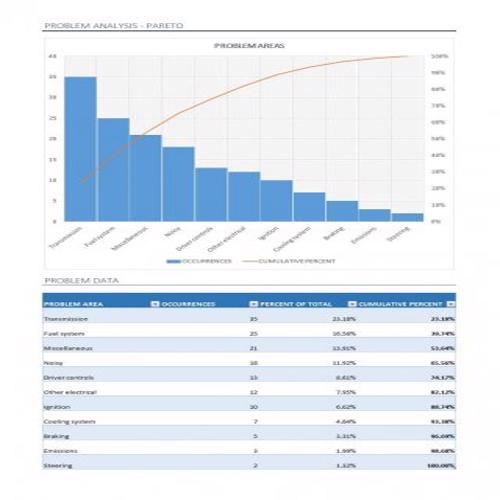
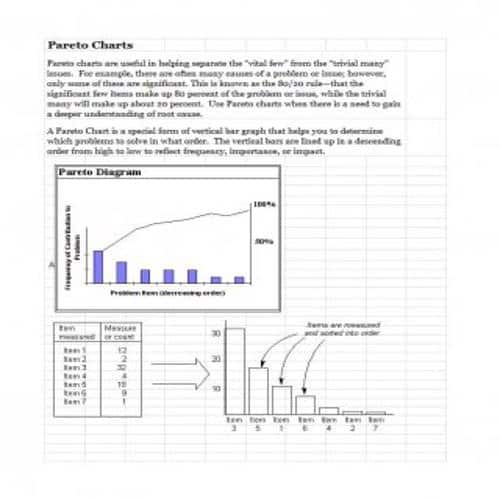
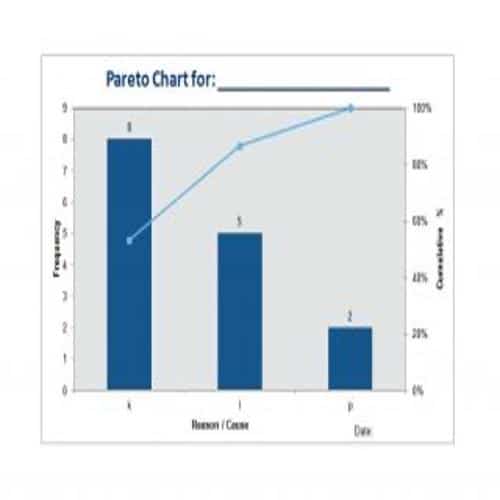
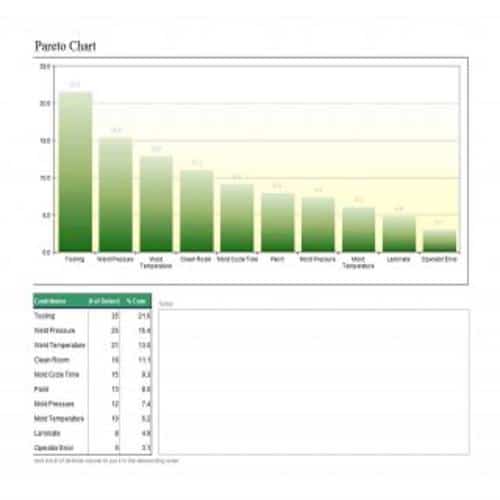
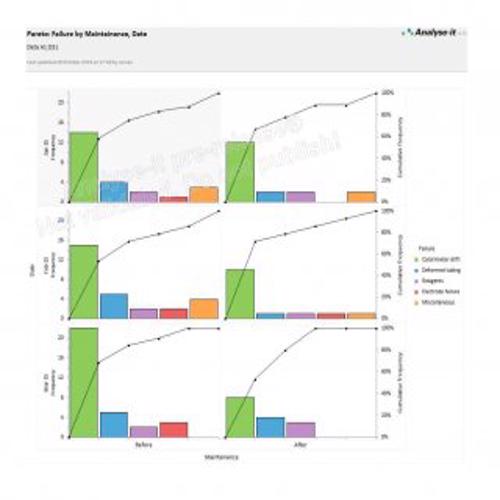
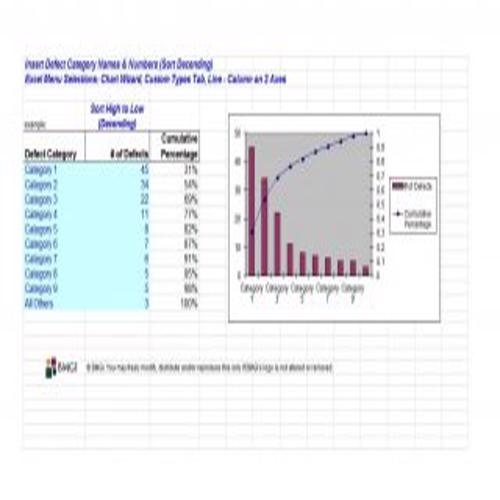
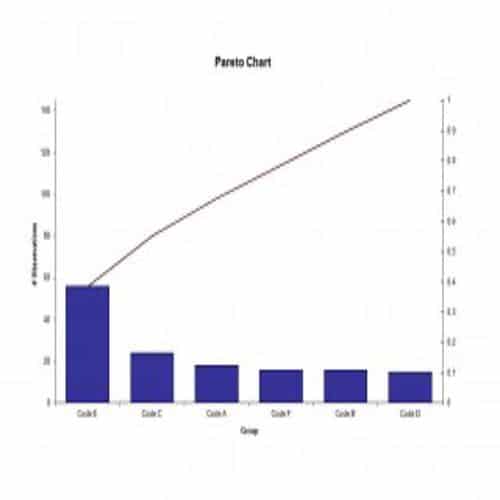
A Pareto Chart is a special type of diagram that contains both the bars and the line. Each bar represents a different value in declining order and the cumulative total is represented by the line. A Pareto Chart is also known as Pareto Distribution Diagram. It is most commonly used for the purpose of quality control of an entity’s products. Many entities create or use Pareto Chart templates for their ease.
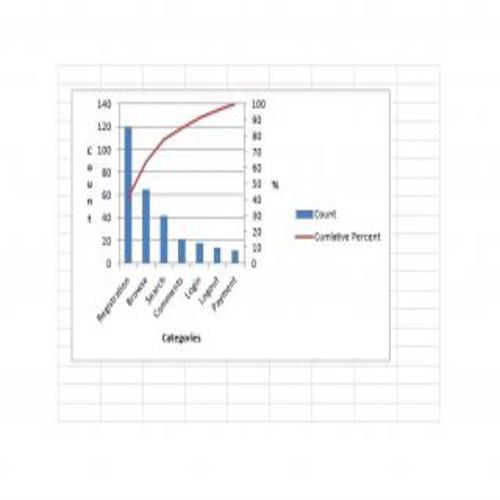
The different values represented by the bars in a Pareto Chart template are actually the different variables that are involved in the production of products. The order of the bars reflects the relative frequency from left to right. A Pareto Chart can also be used during the analysis of problems. Make sure to check out the Pareto Chart templates that are provided for you below.
Useful Pareto Chart Templates
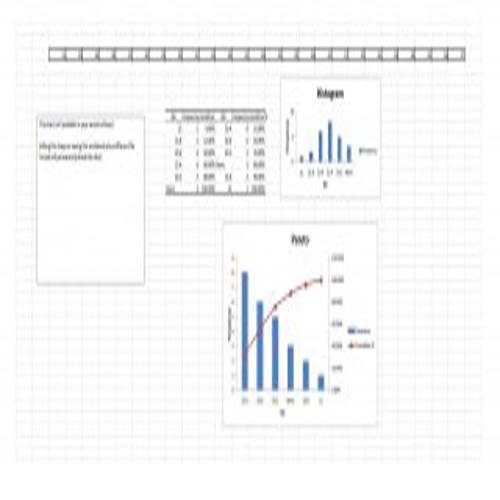
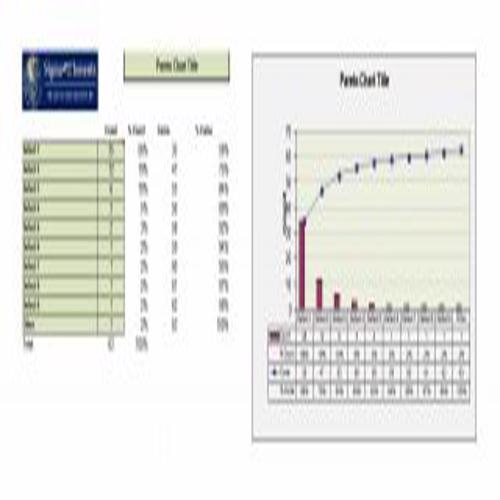
Sample Pareto Chart Template
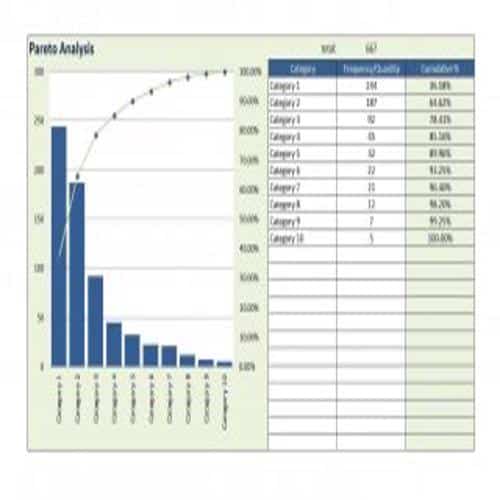
Proper Pareto Chart Template
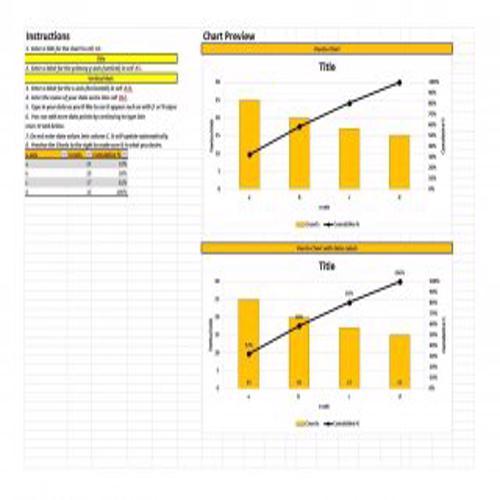
Typical Pareto Chart Template
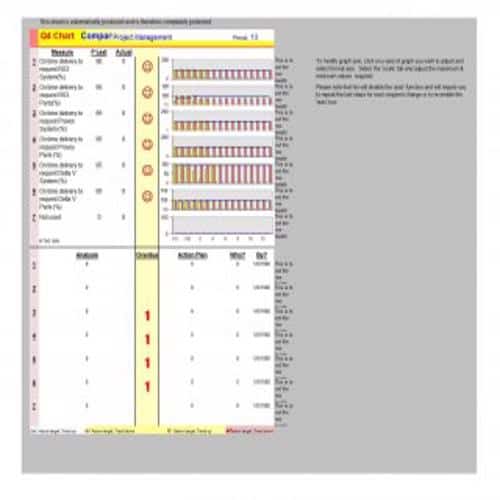
Project Pareto Chart Template
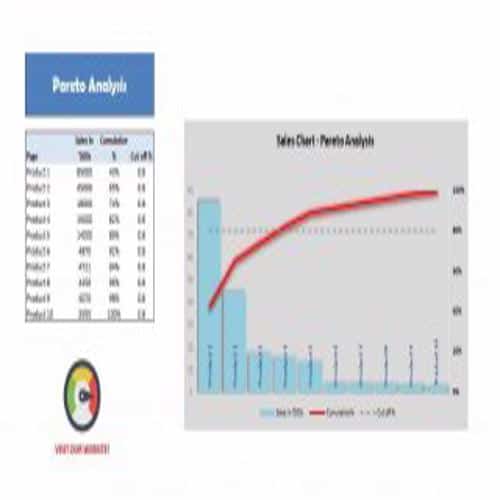
Product Pareto Chart Template
New Pareto Chart Template
Analytical Pareto Chart Template
Exclusive Pareto Chart Template
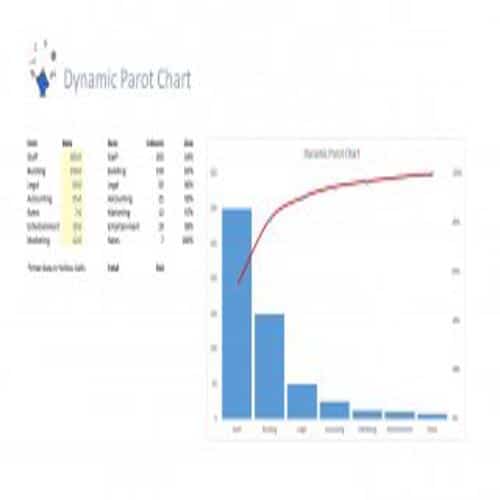
Dynamic Pareto Chart Template
Special Pareto Chart Template
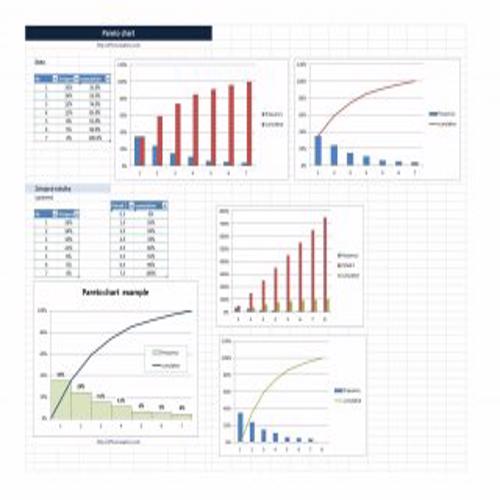
Simple Pareto Chart Template
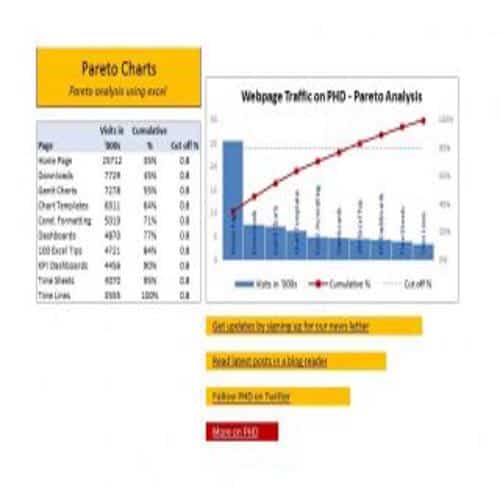
Webpage Pareto Chart Template

Stylish Pareto Chart Template
Usual Pareto Chart Template
Official Pareto Chart Template
Standard Pareto Chart Template
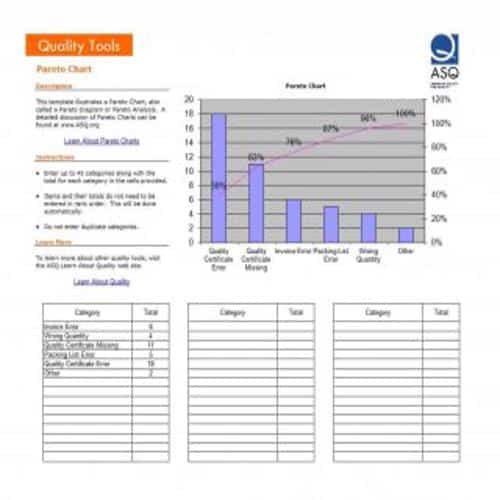
Creating a Pareto Chart Template
In order to create a proper and effective Pareto Chart template, you are required to follow the given below steps:
- Make a complete list of problems, values or items to be compared.
- Set a standard measure for the proper comparison of items, depending upon the cost, frequency or time.
- Choose a period for the collection of data.
- For each item, check how often it occurred, or its cost or total time it took. Then sum up these items in order to determine the grand total for all items. Determine the percentage of each item in the grand total.
- List the compared items in decreasing order according to the set measure of comparison i.e, the most frequent to the least frequent. Now determine the cumulative percentage of each item.
- List the items on the horizontal axis and write the numbers (frequency, time or cost), on the left vertical axis. Write the cumulative percentages on the right vertical axis. After that, draw the bars of each item.
- Draw a line indicating the cumulative percentages. The first point should be in line with the top of the first bar.
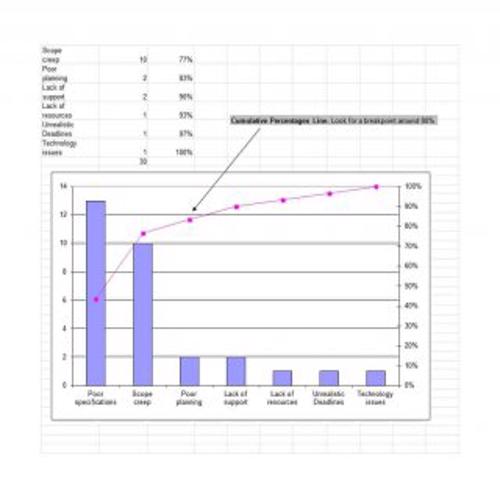
- At the end, analyze the items that were quite difficult to account for. This can be done by looking for a clear break point in the line graph, where it starts to level off quickly. However, if there is no break point in the line, identify the items that account for 50 percent or more of the effect.